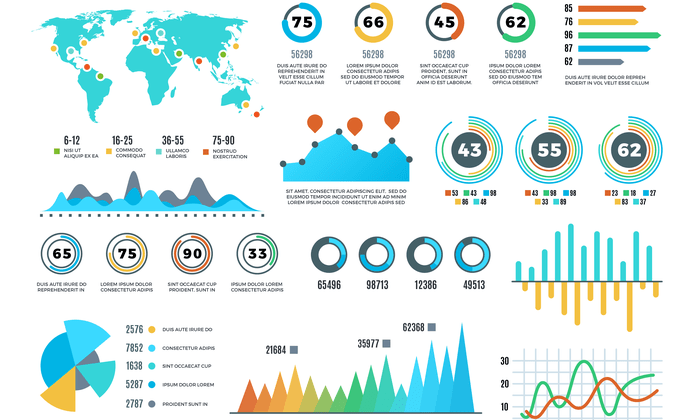
Using Data Visualization in Content sets the stage for a visually captivating journey through the realm of information enhancement. Dive into the world of charts, graphs, and infographics as we explore how visual elements can revolutionize content creation.
Let’s uncover the power of data visualization and its impact on audience engagement and retention.
Importance of Data Visualization in Content
Data visualization plays a crucial role in content creation by making complex information more accessible and engaging for audiences. By visually representing data through charts, graphs, and infographics, content creators can effectively communicate key insights and trends in a way that is easy to understand and retain.
Enhancing Understanding through Visualization
Using data visualization can transform raw data into meaningful patterns and relationships that are not immediately apparent when presented in text form. For example, a bar graph comparing sales figures over time allows viewers to quickly grasp trends and fluctuations, leading to a deeper understanding of the data.
- Data visualization can also help in identifying correlations between different variables, such as the relationship between marketing campaigns and website traffic. Visualizing this data can uncover insights that may have been overlooked in a spreadsheet or written report.
- Infographics are another powerful tool for condensing large amounts of information into a visually appealing format. By combining text, images, and charts, infographics can effectively communicate complex concepts in a concise and engaging manner.
Improving Engagement and Retention
Engaging with data visualization not only enhances understanding but also improves audience engagement and retention. Visual content is more likely to capture the attention of viewers and keep them interested in the information being presented.
- Interactive data visualizations, such as clickable maps or dynamic charts, encourage users to explore the data on their own terms, leading to a more immersive and memorable experience.
- By incorporating visuals into content, creators can appeal to different learning styles and preferences, catering to both visual and auditory learners. This multi-sensory approach can enhance information retention and recall among audiences.
Types of Data Visualization for Content

Data visualization comes in various forms, each serving a specific purpose in conveying information effectively to the audience. Let’s dive into the different types of data visualization methods and their suitability for various types of content.
Charts
Charts are a popular form of data visualization, allowing for easy comparison and analysis of data. Bar charts are great for showing comparisons between different categories, while line charts are ideal for displaying trends over time. For example, a bar chart can effectively showcase sales figures for different products, while a line chart can illustrate the growth of a company’s revenue over the years.
Graphs
Graphs are another powerful tool for visualizing data. Pie charts are useful for showing the composition of a whole, such as the distribution of expenses in a budget. Scatter plots are effective in highlighting relationships between variables, making them perfect for analyzing correlations in scientific studies.
Infographics
Infographics combine text, images, and charts to present complex data in a visually appealing and easy-to-understand format. They are excellent for condensing large amounts of information into a concise and engaging visual piece. An infographic can be used to showcase survey results, explain a process, or present statistical data in a digestible manner.
Maps, Using Data Visualization in Content
Maps are valuable for displaying geographical data and patterns. They can be used to illustrate regional demographics, sales distribution, or the spread of a disease outbreak. By visualizing data on a map, complex information can be communicated spatially, providing insights that may not be apparent in a traditional chart or graph.
Best Practices for Using Data Visualization in Content
When it comes to incorporating data visualization in content creation, there are several best practices to keep in mind. These practices can help you effectively communicate your data and insights to your audience in a clear and engaging manner.
Choosing the Right Data Visualization Format
Selecting the appropriate data visualization format is crucial to effectively convey your message to your audience. Consider the type of data you have, the story you want to tell, and the preferences of your target audience. Here are some tips for choosing the right format:
- Bar charts and line graphs are great for showing trends over time.
- Pie charts are useful for illustrating proportions and percentages.
- Maps are ideal for displaying geographical data.
- Tables are best for comparing specific values.
Maintaining Consistency and Clarity
Consistency is key when it comes to data visualization in content. Ensure that the design elements, color schemes, and fonts are consistent across all your visualizations to create a cohesive look. Additionally, strive for clarity by keeping your visualizations simple and easy to understand. Avoid cluttering your visuals with unnecessary elements that may confuse your audience.
Tools and Software for Data Visualization: Using Data Visualization In Content

When it comes to creating data visualization in content, there are several popular tools and software options available that cater to different needs and skill levels. Let’s explore some of these platforms and compare their features, ease of use, and customization options.
Popular Tools for Data Visualization
- Tableau: Tableau is a powerful tool known for its user-friendly interface and robust features. It offers a wide range of visualization options and allows for easy customization.
- Microsoft Power BI: Power BI is another widely used tool that integrates seamlessly with Microsoft products. It provides interactive visualizations and advanced analytics capabilities.
- Google Data Studio: Google Data Studio is a free tool that enables users to create interactive reports and dashboards using data from various sources such as Google Analytics and Google Sheets.
Recommendations for Beginners and Advanced Users
- For Beginners: If you’re just starting out with data visualization, tools like Google Data Studio or Microsoft Power BI can be great options due to their user-friendly interfaces and ample online resources for learning.
- For Advanced Users: Advanced users may benefit from the more sophisticated features offered by Tableau, which allows for complex visualizations and in-depth data analysis.


