Creating Interactive Infographics opens up a world of creativity and engagement, where design meets interactivity to captivate audiences in a whole new way. Dive into this dynamic realm where visuals come to life and storytelling takes on a whole new meaning.
From understanding the purpose of interactive infographics to exploring design best practices and implementing interactivity, this guide will take you on a journey to master the art of creating captivating visual experiences.
Understanding Interactive Infographics

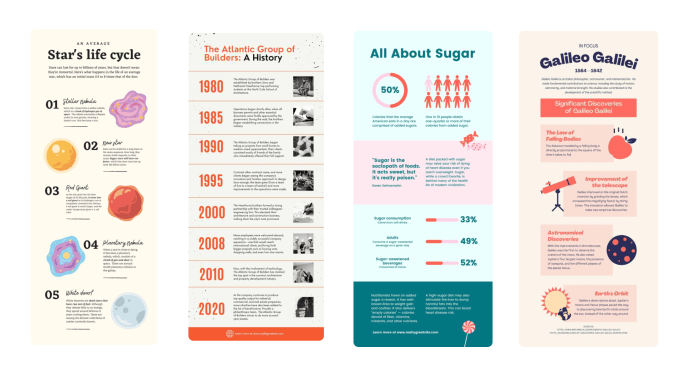
Interactive infographics are dynamic visual representations of information that allow users to engage with the content by interacting with various elements. The purpose of interactive infographics is to make complex data more accessible and engaging for the audience, providing a more immersive and personalized experience compared to static infographics.
Interactive infographics engage users differently than static infographics by enabling them to explore the data at their own pace, click on elements for more information, and even manipulate certain variables to see different outcomes. This interactivity promotes active participation and enhances understanding by allowing users to focus on the aspects that interest them the most.
Examples of Successful Interactive Infographics
- The New York Times’ “How the Virus Got Out” interactive infographic effectively showcases the global spread of COVID-19, allowing users to track the virus’s journey and understand the impact of various containment measures.
- National Geographic’s “The Big Thaw” interactive infographic on climate change uses animations and interactive graphs to illustrate the effects of melting ice caps and rising sea levels, creating a powerful visual narrative.
- The Washington Post’s “The Mueller Report” interactive infographic breaks down the key findings of the report in a digestible format, allowing users to explore the details of the investigation through clickable sections and summaries.
Tools for Creating Interactive Infographics

Creating interactive infographics requires the use of specialized tools that offer a range of features to make your content engaging and informative. Let’s explore some popular tools used for designing interactive infographics and compare their key features.
Popular Tools for Creating Interactive Infographics
When it comes to creating interactive infographics, there are several tools available that offer unique features to help you design visually appealing and interactive content. Some of the most popular tools include:
- Canva: Canva is a user-friendly online platform that provides a wide range of templates and design elements to create stunning interactive infographics. It offers drag-and-drop functionality and allows for easy customization of graphics and text.
- Infogram: Infogram is another popular online tool that offers a variety of charts, maps, and other visualization options to create interactive infographics. It allows for real-time data updates and offers collaboration features for team projects.
- Adobe Illustrator: For more advanced users, Adobe Illustrator is a powerful desktop software that provides extensive design capabilities for creating interactive infographics. It offers precise control over graphic elements and allows for complex animations and interactivity.
Comparison of Features
Each tool comes with its own set of features and capabilities that cater to different user needs. Canva is known for its ease of use and accessibility, while Infogram offers a wide range of visualization options. On the other hand, Adobe Illustrator provides advanced design functionalities but requires a steeper learning curve.
Online Platforms vs. Desktop Software
Using online platforms like Canva and Infogram for creating interactive infographics offers the convenience of accessibility from any device with an internet connection. They also often provide pre-designed templates and collaboration features. However, desktop software like Adobe Illustrator may offer more advanced design capabilities and customization options for users with specific design requirements. The choice between online platforms and desktop software ultimately depends on the user’s skill level, design needs, and preferred workflow.
Design Best Practices
When it comes to designing interactive infographics, there are some key principles to keep in mind. One of the most important aspects is finding the right balance between aesthetics and functionality. This means creating a visually appealing design that also effectively communicates information to the user.
Balancing Aesthetics with Functionality, Creating Interactive Infographics
To achieve a successful balance between aesthetics and functionality in interactive infographic design, consider the following tips:
- Keep the design clean and uncluttered to avoid overwhelming the user with too much information at once.
- Use a cohesive color scheme and typography to create a visually appealing experience that is easy to read and navigate.
- Ensure that interactive elements are intuitive and easy to use, guiding the user through the information without causing confusion.
- Incorporate animation and interactive features sparingly to enhance the user experience without distracting from the main content.
Optimizing User Experience
To optimize user experience in interactive infographics, consider the following tips:
- Design with mobile responsiveness in mind to ensure that the infographic is accessible and easy to use on all devices.
- Provide clear navigation cues and interactive elements to help users explore the content and understand the information presented.
- Include interactive elements that encourage engagement, such as quizzes, sliders, or interactive charts, to keep users interested and involved.
- Test the infographic with real users to gather feedback and make improvements based on their interactions and preferences.
Implementing Interactivity
When it comes to creating interactive infographics, adding elements that engage the audience is key. By incorporating various types of interactions, such as animations and clickable features, you can make your infographic more dynamic and captivating.
Types of Interactions
There are several types of interactions that you can include in your interactive infographics:
- Hover Effects: Adding effects that change when the mouse hovers over a certain area can provide visual feedback to users.
- Clickable Elements: Making elements clickable to reveal more information or navigate to different sections can enhance user engagement.
- Scrolling Animations: Implementing animations that trigger as users scroll through the infographic can create a storytelling effect.
- Interactive Charts and Graphs: Allowing users to interact with data visualizations by hovering over points or selecting different parameters can make the information more digestible.
Adding Interactivity
To add interactivity to your infographics, you can use coding languages such as HTML, CSS, and JavaScript. Here are some tips for implementing interactivity:
- Plan Your Interactions: Before starting to code, have a clear idea of the interactions you want to include and how they will enhance the overall user experience.
- Use Animation Libraries: Utilize libraries like GreenSock (GSAP) or CSS animations to easily add animations to your infographics.
- Responsive Design: Ensure that your interactive elements are responsive and work well on different devices to reach a wider audience.
Tools for Interactivity
There are also tools available that can help you create interactive infographics without extensive coding knowledge:
- Adobe Animate: Use this tool to create animations and interactive elements for your infographics.
- Tableau: Ideal for creating interactive data visualizations and charts that can be embedded in your infographics.
- Infogram: A platform that allows you to easily create interactive infographics with drag-and-drop functionality.


